
Rebuilding for Speed and Adaptiveness
- Chris Gagné

- Dec 9, 2025
- 19 min read
Company Context
The company is a mid-market regulated services provider. Distribution is primarily direct-to-consumer via digital marketing and contact centres, supported by partnerships. The operating environment combines strict conduct and data-privacy obligations (incl. GDPR) with high-volume, compliance-sensitive sales and servicing. Technology spans a core account-administration platform, third-party vendor systems, and growing public-cloud analytics and marketing tooling. The workforce numbers in the mid-hundreds, spread across product, engineering, operations, marketing, compliance, and customer support.
The company states publicly that it competes on trust, service quality, and speed of change while maintaining rigorous controls. The reality at the start of our engagement was quite different. An extremely complicated project management approach, combined with a fragmented and divisive organizational structure, generates significant overhead, high defect rates, and rework, impacting business operations, revenue, brand reputation, and team morale. Insufficient focus on system health, lack of integration with modern tools and technologies, and gaps in best practices have led to escalating technical debt, increased security risks, and the diversion of engineering resources from innovation and value-driven work to maintenance tasks.
On the bright side, team members experience strong support from both peers and leadership. Despite extremely high levels of technical debt, aggressive fixed-date/fixed-scope deliveries are consistently achieved, albeit at great cost to the health of both the technology and people within the organisation. Deadlines are committed to without a full understanding of the scope.
Initial Technology Context
There are three technology departments within the broader organisation:
The primary focus is “TL,” a ~90-person product & development org split into two value streams—Customer Acquisition & Sales and Policy Servicing & Payments—supported by shared platform/cloud (DevOps, DBA, InfoSec), data/QA, and follow-the-sun tech-services/app support, distributed across the UK, North America, and APAC.
TL’s CTO is a seasoned product-and-technology executive with multiple exits who scales mid-market companies and builds high-performing global teams. The CTO was one of the first Certified Scrum Coaches in the world (prior to the CTC/CEC split), but is totally framework agnostic. He has a very strong distaste for “cargo-cult Scrum/Agile” and has no desire to blindly apply any framework, terminology, tools, or processes without a deep, first-principles understanding. We are jointly focused on also making the requisite People, Reward, Structure, and Strategy changes.
I have known the CTO personally for over 17 years, and deeply respect, admire, and trust their leadership. I was hired by the CTO two months after they joined the company having followed them for a 2nd time from a prior engagement.
TL works regularly with two other departments on fixed-date, fixed-scope projects:
● TB: A marketing- and content-centric technology organisation. Approximately 50 people, of which several are either front-end developers or testers. Geographically distributed across English-speaking countries in Europe and North America.
● DW: A several-person cross-functional Data & Analytics group—spanning data engineering, data science, and Power BI development—led by a Head of Data and supporting finance/actuarial and business reporting. Geographically distributed across English-speaking countries in Europe and APAC.
The CTO’s primary goal is to accelerate business growth by reaching the elite performance levels of the top 10% of organisations. The evidence that we rely on indicate that elite teams are twice as likely to exceed profitability, market share and productivity goals and capture 50% higher market cap growth over 3 years when compared to less mature organizations.
Initial “TL” Context through the Org Topologies / Star Model Lens
Strategy
● The dominant strategy, despite an external “speed of change” focus, was to optimise for Resource Utilisation, Cost Efficiency, Output Predictability (in that scope was expanding but dates could not change), Compliance, Confidentiality, and—in a sense—Specialist Expertise either due to a perceived “waste” of multi-learning and/or lack of time to cross-train.

Structure
The organisation structure strongly indicated a Resource Topology:
● There were three large development “teams.” Although the teams were initially described as multi-skilled (TASKS-2) teams, they behaved more like pools of individuals operating as TASKS-1 (Y0/Y1).
● A DBA acting as in a TASKS-1 viewed as operating on a “conveyor belt,” with minimal integration with dev workflows. Further, infrastructure tasks were often handled separately, lacking dedicated sprint capacity for improvements. Database changes were often bottlenecked by a single-person dependency (TASKS-1 Y0).
● System ownership was described as “so fragmented that no one truly owns any part, hindering the development of expertise, quick issue resolution, and the implementation of robust solutions,” again reinforcing a TASKS-1 Y0/Y1 archetype selection.
● There was considerable role overlap and confusion:
○ Inexperienced and untrained Scrum Masters acting as weak facilitators organising status updates as pseudo-Project Managers at best.
○ Technical Product Owners were unclear in purpose, and it was uncertain what they contributed.
○ Some managers had part-time availability or uncertain responsibilities.
● The effective structure was so fragmented that some teams mentioned not knowing who was on which team or how the organization was structured. This suggested a very poor understanding of the TL PART of the business let alone the broader company’s structure.
● Groups were distributed across multiple, broad time zones struggled with limited overlapping hours, further compounding communication challenges.
People
● Nobody in the organisation had any significant Agile training of any kind, including the “Scrum Masters” who were simply re-badged PMI-like Project Managers.
● “Technical Product Owners” lacked relevant skills and it was unclear what value they brought to the organisation.
● Business Analysts had no effective product authority: they were given ambiguous/increasing scope and forced to make it work against hard deadlines.
Rewards
The Reward structures strongly indicated a Resource Topology:
● Career ladders, when present, were poorly designed and reflected the progression of single-skill specialities, not broad multi-learning. Domain knowledge was not rewarded.
● Some noted they feel supported, while others felt overworked and/or uncertain about constantly changing priorities.
● Repeated “crunch mode,” weekend work, and genuinely unyielding deadlines caused stress and burnout.
● Some employees expressed frustration at being stuck in reactive tasks with minimal chance to apply creative solutions.
● Some employees mentioned wanting more opportunities to innovate, experiment with new tech, or participate in hackathons.
● Despite this, people often described a friendly, collaborative culture with “minimal egos or friction,” which I’ve found to be true; the senior leadership is both deeply intelligent and humble enough to recognise novel ideas if they are well-supported by data and evidence.
Process
Given the organisation's Strategy, Structure, People, and Rewards, it was no wonder that the Process reflected a “Agile in name only” environment:
● Large projects were planned in detail by CAPS-1 (possibly PART-1) Project Managers in consultation with other CAPS-1 individuals in other departments, sometimes other companies (such as service providers). Waterfall-like practices dominated large projects, with extensive upfront requirements and big release bundles, necessary given the Resource Topology and many cross-team, department, and company dependencies. These were managed with 500+ line Microsoft Project plans. Mid-project scope changes inevitably occured without the possibility of adjusting timelines, forcing teams into last-minute rushes that compromised quality and team member well-being.
● Work was frequently assigned (“push”) to individuals with often siloed knowledge of technical systems, rather than self-organized or pulled by whole teams, reinforcing TASK-1 patterns. As a result, Sprint Planning was all about filling Sprints with tasks rather than focusing on outcomes or user value, reinforcing a TASKS- level Scope of Work selection.
● Daily stand-ups often had 30+ invitees, often turning into monologues or large status calls rather than collaborative problem-solving. There was minimal interactive discussion.
● There was not a consistent pattern of well-facilitated Retrospectives, reinforcing a Resource Topology diagnosis; individual “doers” were not expected to contribute meaningfully to continuous improvement.
● Due to requirements being handled—at best—by isolated CAPS-1 (possibly PART-1) individuals and groups within the department (more often outside of the department and even outside of the company), the delivery of requirements was completely unmoored from the development process. This resulted in requirements arriving well into the time-bound development window, frequently too late for effective QC and integration planning. QC individuals and groups complained of unclear and shifting requirements, resulting minimal time available to develop comprehensive coverage.
● Velocity was sometimes recorded but frequently overshadowed by urgent KTLO/BAU tasks, defects, and other mid-Sprint additions, making the data effectively useless for planning.
Tooling (Process sub-set)
● The department used Jira but it was poorly tended to. Issues in Jira were generally not correctly statused, resulting in virtually zero situational awareness as to the broader systemic picture. Jira issues often detailed granular tasks (“create a stored procedure”) without context of larger goals. Jira tickets had priorities (e.g., “Highest”) without a documented prioritization framework; teams often react to “fires,” hotfixes, or immediate tasks. Worse, much work was also tracked in Excel and Word documents being emailed around, creating even more fragmented tracking and version contention.
○ As a result of the above, it was not understood just how understaffed the department was (service rate) relative to the demand (arrival rate).
Terminology (Process sub-set)
● Owing likely to prior shallow “Agile transformations,” inconsistent usage of “agile language” (stand-ups, sprints) led to cynicism about developing real agility. This is entirely consistent and to be expected given the entrenched, poorly-trained Scrum Masters with PMI-only backgrounds and the like applying only the terminology from Scrum (e.g., Larman’s 2nd Law).
○ This is to say nothing of senior leadership, who—while extremely intelligent, well- trained, well-meaning, and competent in their operations—were naïve to adaptive org design principles within a technology context. Thus, they were unable to recognise the limitations of—let alone change—any of the organisation design beyond terminology and team-specific processes.
Technical Health
● Environments were confusing, with separate pipelines for UI, services, and DB further suggesting a siloed, top-down, resource topology.
● Strong architecture diagrams and environment details were not understood or rewarded, and thus were inconsistently documented.
● Industry-standard DORA metrics were not being collected, though the organization clearly operated at a low maturity level. A proprietary assessment developed by the CTO and I also revealed a low-moderate maturity level at best.
● Quality-related metrics (e.g., defect escape rate) existed but were not consistently acted upon. A high volume of production issues and urgent tasks consistently disrupted planned Sprint work, which still continues until today.
○ Personally, I have seen more P0/P1 level incidents at this company than virtually the entire balance of my career combined.
The CTO’s Immediate Interventions
The CTO joined the company a couple of months before I could follow him. I was able to provide ad-hoc coaching in the meantime, including introducing him to Org Topologies. I had not previously been successful introducing LeSS due to his rightful distaste of any “Agile framework,” but Org Topologies spoke to him quite clearly. He remarked “I wish I had my name on this.”
In the interim, based on our prior work together and their existing knowledge of adaptive software development, the CTO quickly:
● Divided the three large TASKS-1 (Y1) teams into several CAPS-2 teams organised under two value streams.
● Created clear “enabling groups” for IT (Cloud & Infrastructure, follow-the-sun Application Support, and similar services) and Platform (e.g., web/service/DB upgrades, logging/monitoring, test automation, etc), largely TASKS-1 and TASKS-2 teams.
● Terminated the Technical Product Owner roles.
● Terminated the Scrum Master roles in consultation with me (otherwise they would have reported to me).
● Brought me on as the company’s Enterprise Performance Coach.
● Implemented the first version of the “Minimum Viable Bureaucracy" (hereafter MVB) I wrote over our prior two engagements together.
My Immediate Interventions
When I joined, I assisted the CTO by:
● Significantly updating the MVB, with the following mandate: “a razor-sharp, adaptive system that tames complexity, fuels global collaboration, and unleashes rapid innovation. The result? Hyper-growth, high-impact execution, and unstoppable team … embracing complexity science [Cynefin], a focus on adaptiveness over short-term efficiency [Larman], designing the organisational structure to influence culture [Lean/Larman], and minimise “wasteful” overhead that doesn’t bring value to end users [Lean].” I also wove in Org Topologies concepts throughout the document.
○ This was a major rewrite from prior versions that did not fully embrace LeSS-like approaches.
○ Given that it was a large document and growing, I borrowed a “fractal” writing technique from architect Christopher Alexander’s book “The Timeless Way of Building” that allowed for three depths of reading: descriptive headings, short summaries, and detailed information.
○ I invested heavily in both teaching and mentoring teams and leaders alike on this MVB, starting with first principles.
● Began mentoring his direct reports for 30 minutes each week and providing fortnightly 50-minute developmental coaching sessions.
● Sunsetted the use of Jira within the TL department and replaced it with Shortcut, a simpler tool with many fewer anti-patterns and fewer degrees of potentially self-destructive freedom. We started clean in Shortcut and did not automate any data migration from Jira.
○ From day 1, I aggressively maintained data quality in Shortcut through spot mentoring and reporting.
● Interviewed new Product and UX leaders.
● Customised and implemented a Bug Prioritisation and Resolution Framework that followed these principles:
○ A good process will have different people with the same information get to the same decisions most of the time.
○ High importance Bugs are quickly handled.
○ Low importance Bugs don’t derail high-value initiatives.
● Customised and implemented a P0/P1 incident management and after action review process based on my experience developing an incident management process at PagerDuty.
● We considered the idea of a parallel organisation following Larman’s advice, but given the size of our department and the broader organisational context, we found it to be a non-starter.
First Topology Iteration

Strategy
Make initial moves away from Resource Topology to a Delivery Topology in the context of a high-pressure (demand ~3.7x capacity), high-stakes environment at the organisation’s maximum sustainable state of change.
Structure
● We eliminated the TPO and Scrum Master roles entirely.
● We hired a particularly skilful Product Manager and UX Researcher to join our team.
● We renamed existing BAs as SPMs (“Software Product Managers”) to help indicate a shift in role expectations.
● We chose two “Value Stream Owners” to act as LeSS-like APOs, with the CTO and CMO jointly acting as the Overall Product Owner.
● We began to create cross-functional teams through a vendor in APAC.
● The CTO is represented as a multi-skill individual at PART-2, along with myself as the coach.
Rewards
Our career ladders have been considerably improved:
● Much more articulation of the expectations for an individual to be at any given level, resulting in more fairness and predictability.
● Reduction of various specialised developer roles to a single Engineering role supported by (for now) a separate Cloud&DevOps track.
● Analysis replaced with Product Management expectations.
● Considerations for how these roles would leverage generative AI.
Process
● The “Minimum Viable Bureaucracy” process is mostly being followed, with the exception of regularly-scheduled department-wide retrospectives and Iteration Reviews.
○ High manager demand coupled with time-zone difficulty makes department-wide retrospectives challenging, but we do use after action reviews at major milestones.
○ Our process is still a fairly deterministic project approach on largely well-understood work (replications of product launches), so there is less demand and capacity for iterative software development. As our People and Structure evolve, we expect to use Reviews each iteration.
Limitations
We acknowledge that there are still many significant limitations with this topology:
● Value streams and “enabling groups.” While we understand the long-term risks of creating single-product value streams that run the risk of delivering marginal-value features (e.g., the “Google cat paw” Easter egg), this shift from TASKS-1/-2 (Y0-Y1) archetypes to CAPS-2 was a bold “next adjacent possible,” especially with the limited time budget available to implement broader multi-learning patterns.
● DevOps as a separate function. I recognise from my time at PagerDuty that “DevOps” doesn’t mean an external team doing operations, because that’s basically the exact opposite of the portmanteau “developers doing operations.” We do not presently have either the time to support DevOps skill development with our current development team due to extreme fixed-date, unknown-but-increasing scope pressures. We do not have the budget to augment all teams with skillful DevOps mentors, however we did hire a very skilful VP that both the CTO and I have known for many years who will assist us in upskilling our teams.
● Platform and Cloud & Infrastructure teams as a separate function. Here too, we do not have either the time to support multi-learning nor the budget to add additional subject matter experts to our teams at the moment, but we have been surprised to discover a lower-than-expected volume of dependencies on these capabilities. Our primary delivery teams are arguably CAPS-2+, not fully end-to-end on all work but capable of doing most value delivery on their own.
● We have too many BAs acting as extremely junior “Software Product Managers” (“SPMs”) and our Value Stream Owners have neither the authority nor the expertise to fully succeed in their roles. As a result, our CMO and CTO are managing most higher-order prioritisation, with VSOs and SPMs filling in some of the gaps. As the SPMs spent the majority of their careers as order takers from “the business” and do not have strategic product development experience, they’ve needed a substantial degree of hand-holding. We have, however, avoided the trap of creating “team output owners,” with SPMs acting as SMEs for projects (a BA-type function) rather than allow them to locally priortise individual team backlogs as their primary objective. The SPMs also spend a non-trivial amount of time providing unrelated operational support to other departments.
Second Topology Iteration (current work)
We are now aggressively expanding with the support of an outsourcing company in APAC with whom the CTO has a long relationship. We treat them as staff augmentation and require them to follow our organisational design.
Structure
The next gesture will be to continue developing skills within the Value Streams by:
● Hiring enough people with high-value skills (e.g., DBA) to join the Value Streams and travel/enable within the Value Stream. For instance, we now have one skilful DBA supporting all work across the Department. We are planning on hiring one DBA per Value Stream to travel to Feature Teams within the Value Stream when necessary to support their work hands-on in the short-term and build DBA skills within the team in the long-term. This is represented by the shift of the team-of-teams from CAPS-2 to CAPS-3 and the dissolution of the separate DBA-specific backlog.
● Hiring and developing Software Product Managers to be more multi-skill, especially when it comes to AI-assisted prototyping. This is represented by the shift of the SPM pool from CAPS-1 to CAPS-2.
Arguably this would be the first expression of a Delivery Topology:

Backlogs
We are also promoting the use of “one backlog” across the entire organisation, not just within TL. This is manifested through custom reporting that I’ve developed on top of our story management software. In truth there are dozens of backlogs, all in the following hierarchy:
Department → Value Stream / Enabling Group → Capability → Team
These are represented in the backlog names:

Across these backlogs, we are aiming for the following blend of backlog items (called “Stories” by our tooling).
Across these backlogs, we are aiming for the following blend of backlog items (called “Stories” by our tooling).

We track this in our reporting tooling today:

This is presently a far cry from our ideal case: most of the requirements live on team-level backlogs, suggesting that our expression remains closer to a Resource or Delivery Topology rather than a Driving one.
Third Topology Iteration (Planned)
As we continue to grow our department and help our people develop software more quickly and iteratively, we anticipate that stakeholders outside of our department will take an increased interest in collaborative software development. We anticipate an evolution from a Delivery Topology to a Driving Topology. Some outstanding questions:
● At what level will detailed, synchronous planning occur?
● Will we be able to federate this by independent Value Streams (fewer teams needing to coordinate planning at once reduces time zone pain), or will we need to continue department-wide planning?
● How do we address the fact that we have developers in the Americas, EU, and APAC?
Sophisticated Reporting Informs Action
The above demonstrates a reasonable understanding of Org Topologies and application in practice, especially given the 2-month window provided for complimentary certification following the courses. However, I believe my proprietary work suggests a deep understanding of the principles and provides evidence to support the value of multi-learning.
Thanks to high data quality within Shortcut, we are track detailed metrics for each level in the hierarchy, including:
● Pts/iter (adj): Adjusted story points completed per iteration (each iteration is a two-week/fortnight sprint, aligned across the department). This metric reflects net delivery capacity after subtracting unplanned work. Points represent relative complexity, uncertainty, and effort rather than time.
● CV % (Coefficient of Variation): Measures plannable delivery consistency across iterations using the weighted velocity model. Lower values indicate predictability. A CV above 20% indicates volatile delivery and reduces confidence in ETAs.
● Unplan %: Percentage of completed work that was not planned in the iteration commitment. Higher values reduce available capacity for strategic, roadmap-aligned work and increase delivery risk.
● WIP/Builder: Average number of stories in progress per builder. Because each builder has finite focus, higher WIP increases context switching, lowers flow efficiency, and leads to slower delivery.
● Unest %: Percentage of backlog stories without point estimates. This directly reduces forecast accuracy, as points are the unit of capacity planning and flow measurement.
● Queue Length: Estimated time to clear the backlog at current velocity. The value shown depends on forecast mode:
○ Operational Mode (P70–P95) – realistic range (practically P50–P90 today),
○ Aspirational (P50–P85) – optimistic (practically P25–P75 once we get more mature),
○ Raw mathematical P50 – median only (but empirically closer to P10 today in reality due to right-skewed delivery).
● Avg. Story Size: Average story points per item, indicating team slicing discipline. Large averages can signal overly complex work items or estimation drift.
● Stories: Total number of incomplete backlog items, representing work inventory that has not yet been delivered.
● Points: Total estimated story points remaining in the backlog. This is the aggregate volume of work still to be completed, expressed in the same relative complexity units used to measure capacity.
● Pts/wk: Adjusted velocity converted into story points per week, normalizing for the two-week iteration length so teams can be compared and long-range forecasts can be made on a weekly basis.
● Pts/yr: Projected delivery volume over a full year at the current velocity, using the decayed weighted average model. This informs portfolio capacity planning and budgeting.
● Pts/iter (raw): Gross story points completed per iteration before subtracting unplanned work. Shows total throughput, but overstates capacity available for strategic work.
● Included Iterations: The number (or range) of past completed iterations used to calculate velocity and CV. Velocity uses a 13-iteration window (approximately six months) with exponential decay (0.9 weighting), meaning more recent iterations have greater influence.
Because we track these metrics at all levels of our hierarchy, we can leverage them to illustrate the benefit of improving our org design to be less TASK- and CAP-centric, and more PART- and even WHOLE-centric. How? Consider the following table of data for selected Teams, Capabilities, Value Stream, Department, and the Whole. Here, we’ll focus on the Pts/iter(adj), CV %, and Queue Length in particular.
Examine the team TL:PL:Policy Management:1, which has been operating since week 17, 2025. Their raw points/iteration is 25.3 points/iteration, but 25% of their completed work was not “planned” for at the beginning of the iteration or pulled in with extra capacity, so their adjusted points/iteration is 18.8. They’ve got 1960 points in their backlog, so we would expect that to be done in just over 4 years (1960 / 18.8 = 104 iterations, or just over 4 years assuming 25 iterations/year). However, the high CV of 59% places the P70 queue length at 9 years, and nearly 20 years at P95. This is clearly indicative of a problem.
TL:PL:Policy Management:2 joined from APAC in week 29, 2025. Although they have less Unplanned work (only 17%), they’re still ramping up as evidenced by the high CV of 72%. Here, the 30 points in the backlog should take 4 iterations at 7.5 plannable points per iteration, but the high CV% pushes out that queue length to 3-4 months at P70-P95.
At the moment, TL:PL:Policy Management:2 is on the cusp of being able to work on everything that TL:PL:Policy Management:1 does. Once that materialises, we would move almost all of the work from the TL:PL:Policy Management:1 and TL:PL:Policy Management:2 Team backlogs to a newly created TL:PL:Policy Management Capability backlog (only implied as a level today as evidenced by the parentheticals around “TL:PL:Policy Management”). We’d still maintain the Team-level backlogs: work moves here at Sprint Planning 1 (to use the LeSS term) and a small amount of team-specific work (such as team-specific Retrospective action items) could live here as well. This is how we can maintain our team-specific metrics (for now).
Note, however, that we don’t have to move the work yet to start to see the potential benefits; this report provides a projection. Nobody would be surprised by the increased plannable velocity for the capability of 26.3: just the sum of the two team’s plannable velocities of 18.8 and 7.5. The real surprise on this metrics table comes from the CV% and queue length. Notice that with the addition of the second team, the P70-P95 queue length drops to 5.7–11.7 years. Still not ideal by any stretch, but a considerable improvement over 9–19.7! Note that this isn’t improved only due to the better velocity, but also due to the lower CV%.
This shows the adaptiveness benefits that occur from moving from a TASKS-/CAPS- borderline level towards a CAPS-/PART- borderline level. We have four levels of hierarchy within our department so there is not an exact mapping to Org Topologies, but the overall concept is still consistent.
What happens if multi-learning continues? We’d go from the Capability level to the Value Stream level. Here again the entire Value Stream’s queue length goes down not only due to the increased plannable velocity, but also due to the reduced CV! What might have taken 9-19.7 years for the TL:PL:Policy Management:1 Team on their own can be done in 3.4–6 years with the entire TL:PL Value Stream participating, which also includes everything else (~30% more scope) the Value Stream plans to do! (We could argue that the Value Stream planning level sits somewhere between CAP- and PART- in Org Topologies terminology.)
Of course, this can be further expanded to the TL Department. I’ve not shown other Value Streams, Capabilities, or Teams within TL, but note here how the CV improves even further, which drops the Queue Lengths even further, despite including the scope from the other hidden backlogs within this department.

This spills into other reporting, too.
We’re familiar with LeSS’s illustration of multiple vs single backlog value as follows:
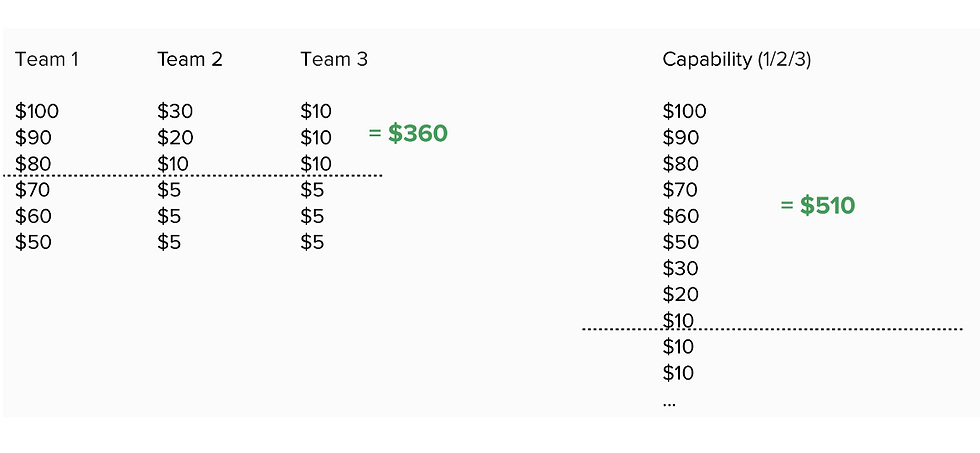
I am experimenting with a version of my reporting that can capture per-Story cost-of-delay and uses that to show differences in value delivery based on the organisational design. However, it is possible to simplify this a bit conceptually:

Notice how items are ranked 1-10, with 1 being most valuable. The left illustrates a Team-level backlog, with most items on the left team and items 2, 4, and 10 on the right team. In this case, item 10 will be done in Iteration 3, before higher-ranked items 6-9. It is done 2 iterations earlier in the Team case than the Capability case. More generally, whenever the Team ETA is before the Capability ETA (or the Capability ETA is before the Value Stream ETA and so on), this means that lower-value work is being prioritised before higher-value work.
We can now combine the impact of these metrics into detailed forecasts! Please note this row in another table.

Here’s what we can ascertain:
● This is Rank 171 in the global backlog view.
● There are 170 undone stories in front of this one, including 3 that are ≥13 points.
● This story belongs to TL:PL:Policy Management:1 and their P70|P95 Team ETAs are 17-22 November. There is a ⚠️ icon here and the tool tip warns: “⚠️ Local optimisation—value loss likely. Ships earlier if taken by this Team, but a shared Capability backlog would deliver more total value first.”
● Notice that the Cap. ETAs are 30 Nov – 10 Dec and the VS ETA is 8–18 December. Here too, there is a warning on the Cap. ETA.
Here are the tool tips for each of the ETAs for the same Story illustrating the reporting’s “intelligence” and usefulness as a teacher:

Going back the other way, here’s a Story on an Epic:

Note that with the current Team ETA, we’re looking at late Jan to mid-March 2026. If TL:CSO:Workflows:1 completes multi-learning and they can collaborate on a single TL:CSO:Workflows Capability backlog with the TL:CSO:Workflows:2 team, we should expect this to be delivered 1–2 months sooner. If there were complete multi-learning across the entire Value Stream, we’d see this Story completed 2–3-½ sooner.
This report allows anyone to filter for any Label, Backlog/Team, Epic, IDs, or requester, allowing everyone in the org to get an approximate ETA with the data known to us today without needing to understand velocity, etc. Put another way, I’ve designed tooling that coaches teams and leaders on the impact of their organisational design on delivery.
I’ve done this for large requirements, too. Here’s a report for an “Epic,” which Shortcut casts similarly to other tools like Jira (large requirement, not sortable on the same backlog as Stories, mostly a project metaphor).
Notice that I can give P50-P95 estimates based on whether or not we have multi-learning: Team (no multi-learning), Capability (~CAPability-specific multi-learning), or Value Stream (~PART-wide multi-learning). I can illustrate—mathematically, adjusted with classical statistics—how value would be delivered weeks earlier. Suppose my cost of delay for this Epic is $500K/week. Assuming we are going from no-multi-learning (Team ETA) to capability-specific multi-learning (Cap. ETA) and we are using the P85 dates, I can show an approximate $1.25M value in obtaining capability-specific multi-learning for this project alone as it is forecast to deliver about 2-1/2 weeks earlier with that structure!
Epic: [Redacted]
Progress: 115/150 Stories, 355/470.8 Points (75%) across 10 Teams
Completion Forecasts by Organizational Level
Completion dates show the maximum ETA across all epic/label stories at each organizational level. VS ETA reflects the longest-pole story among all Value Stream teams, Cap. ETA among Capability teams, and Team ETA among individual teams. Shows opportunity cost of team boundaries.

Backlog Distribution

Written By Chris Gangé