
MADE · STEP 1 · MAP
Map your
organization.
A simple language and one map to see how your organization really works — without “agile” or framework jargon. You can’t figure out where to go next until you know where you are.
ACADEMY
Learn the Org Topologies approach
Practitioner (C-OTP) and Consultant (C-OTC) classes, live online and in person.
THE MAP
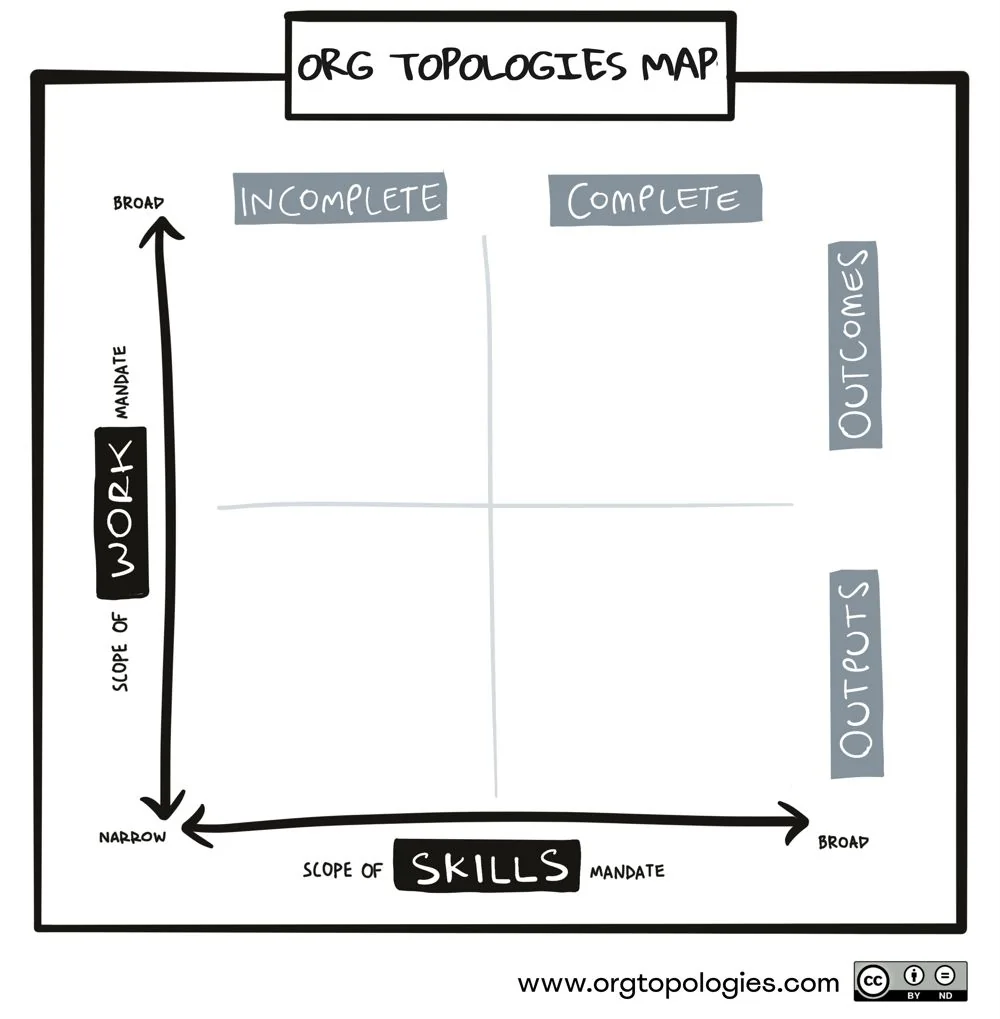
Two mandates, one map
Place every unit — a person, a team or an AI agent — by the two mandates it is given, not by its title.
Scope of skills mandate
Which skills a unit may apply. Left of the divider it is incomplete: it needs others to deliver customer value. Right of it, complete: it delivers without dependencies.
Scope of work mandate
How much of the work a unit owns. Below the divider, tasks and capabilities: outputs. Above it, partial and whole solutions: outcomes. More output does not mean more outcomes.
Four intelligences, shaped by mandates
What an organization can sense, decide and do does not live in its people or its tools. It emerges from the mandates each unit is given. Narrow mandates constrain intelligence; broad, coherent ones expand it. A position on the map describes organizational power, not human worth.
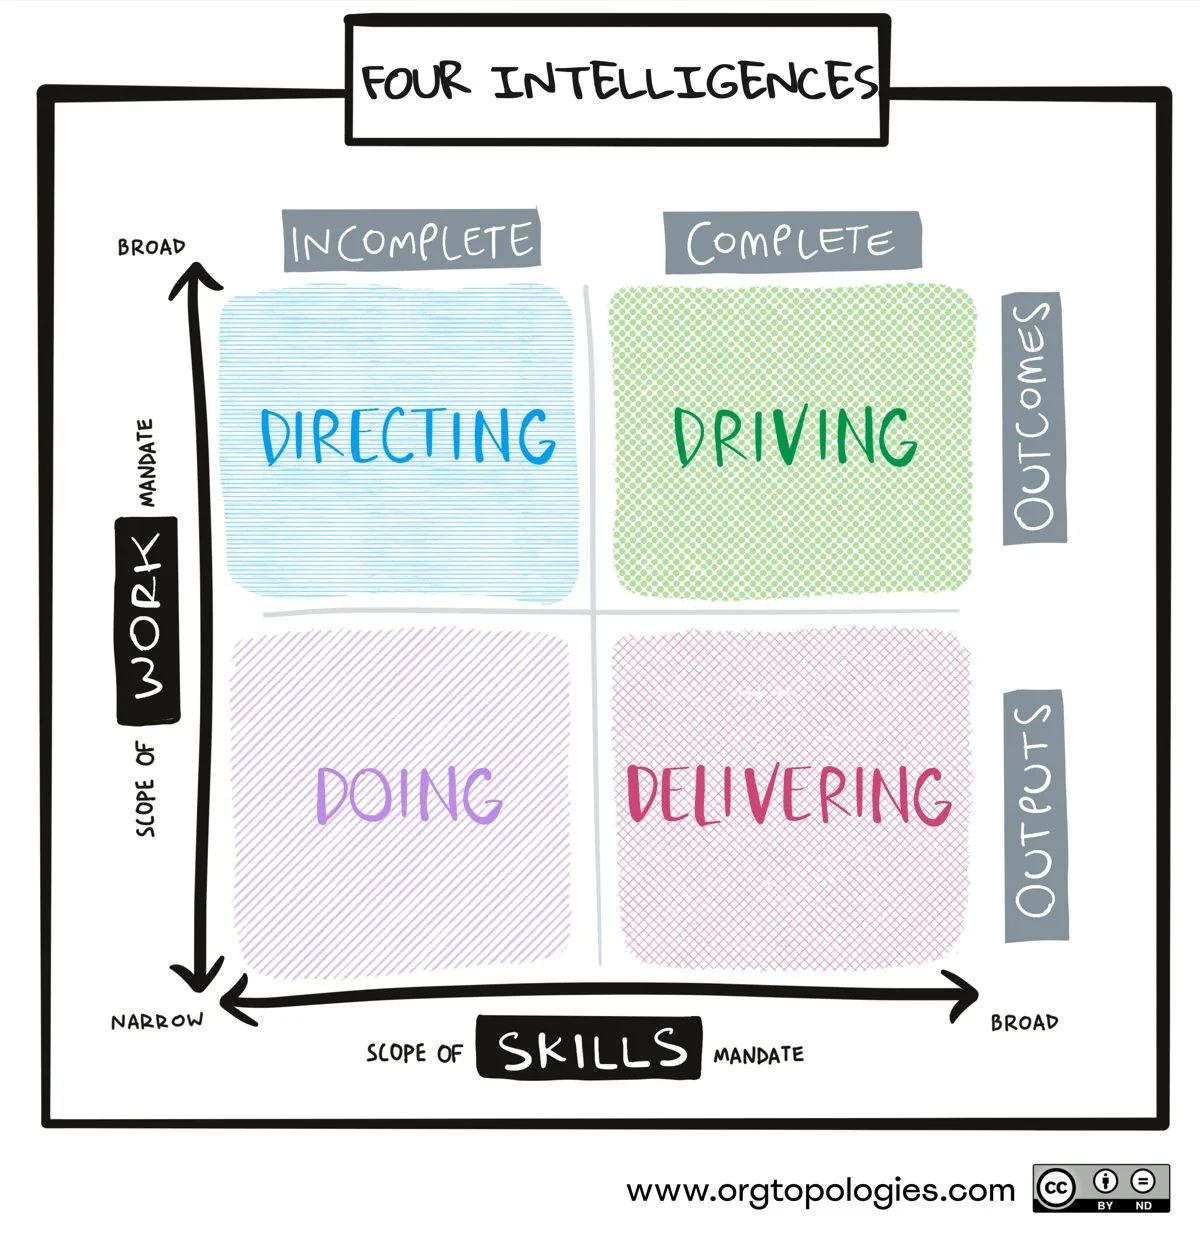
The two dividers cut the map into four quadrants: Directing, Driving, Doing and Delivering — the four intelligences.
DIRECTING
Coordination intelligence
Oversees the whole solution space with centralized control. Lacks skills to create value directly but adds value by coordinating others’ work through planning and control.
EXAMPLE · A business analyst writing requirements.
WITH AI · risks an illusion of control — unless it brings leaders closer to real work.
DRIVING
Adaptive intelligence
Focused on owning outcomes and shaping what gets built next. Blends discovery and delivery, using real customer signals to refine both the problem and the solution.
EXAMPLE · A three-person startup, or a team-of-teams.
WITH AI · a multiplier that eases cognitive load in new domains.
DOING
Specialization intelligence
Highly skilled in narrow domains. Excel at precision, quality, and efficiency within well-defined boundaries. Act as deep specialists focused on defined tasks rather than outcomes.
EXAMPLE · A line cook executing recipes perfectly.
WITH AI · automates tasks — but faster tasks only speed up local output.
DELIVERING
Flow intelligence
Creates value independently within a defined work area. Masters a complete Definition of Done, shipping results quickly while staying within defined boundaries.
EXAMPLE · An e-commerce search team.
WITH AI · as a teacher, lowers the cost of learning the wider system.
FROM THE BOOK · 10X ORG, PRINCIPLE 3: SHAPE INTELLIGENCE WITH MANDATES
Just as people can be “word smart,” “logic smart,” “music smart,” and so on, organizations express different smarts—intelligences—through their structured mandates given to org units.
Organizational intelligence is not a fixed trait and does not reside in individuals. These qualities emerge from the system itself—specifically from the mandates that define who is allowed to decide, act, learn, and shape outcomes. When mandates are narrow, intelligence is constrained. When mandates are broad and coherent, intelligence expands.
The question is no longer which intelligence is “better,” but which combination best supports the current strategic challenge—and how that mix must evolve as strategy changes. … Organizations are not locked into a single intelligence; they can intentionally develop neglected ones and combine them to support performance.
DETAILED MAPPING · THE 4×4
Sixteen archetypes, one language
The 2×2 shows the four intelligences. For detailed mapping of org units there is a 4×4 version: four levels on each axis and 16 archetypes — common patterns of how a unit is structured and operates, each with a short name.
How the names work
The prefix names the work-mandate row (TASKS, CAPS, PART, WHOLE); the digit names the skills-mandate column, counting from the left. So CAPS-3 reads “end-to-end @ capability” — a complete unit, output-oriented, in the Delivering group.
Scope of skills mandate →
- Functional — specialists in one functional area, e.g. a movie costume department.
- Multi-skill — cross-functional but still incomplete, e.g. a surgical team relying on post-op care.
- End-to-end — everything needed to deliver complete value, e.g. a software feature team.
- Expanding — end-to-end, with the mandate to acquire new skills when needed, e.g. a special-forces team.
Scope of work mandate ↑
- Tasks — fine-grained tasks matching one expertise, e.g. a sous-chef preparing ingredients.
- Capabilities — a full capability (feature, function, service element), e.g. a claims-processing group.
- Partial solution — one business vertical, e.g. Uber Ride versus Uber Eats.
- Whole solution — holistic problems and customer value, with no permanent separation inside the unit, e.g. a two-person Instagram-like startup.
Ecosystem Mapping
Mapping Benefits
A simple notation and a few sentences describe a whole ecosystem, so it can be grasped as a whole, its challenges recognized, and a conversation about improving it can begin. Not team by team: improvements at the team level rarely stick. The units of an ecosystem depend on each other, so they have to be improved together, as one system.
Mapping Language
ECOSYSTEM 1 · TODAY
Most of the teams are CAPS-2: multi-skilled, yet incomplete, lacking certain capabilities. Functional TASKS-1 specialists support them. That creates dependencies, which CAPS-1 and PART-1 groups manage.
ECOSYSTEM 2 · IMPROVED
The specialists join the teams, so most teams become CAPS-3: end-to-end, with every skill needed to deliver a whole capability. One team grows into CAPS-4 and learns new skills when the work asks for them. With far fewer dependencies, the CAPS-1 coordination group is no longer needed; a PART-1 group still sets the direction. Together that is a Delivery Topology.
2×2 or 4×4?
Lead with the 2×2. Reach for a specific archetype name when it genuinely sharpens the point — or when someone asks.
HOW TO MAP · GO SEE
Go see, with a map
A topology is never assessed from a desk. Mapping and the Gemba, the place where the work actually happens, make each other better. Map without judgment, with curiosity, and together.
STEP GOAL · FROM 10X ORG
Which parts of our organization contribute to creating value, and how do they interact to produce it — from idea to cash?
CORE VALUE · Curiosity
The outcome
Which business outcome are we mapping, and who has to work on it?
The kind of work
What does the unit take on toward that outcome?
Its inputs
What does it rely on, and from where?
Its outputs
What does it produce, and for whom?
The flow
How does work move — idea to cash?
Go See feeds the map
You can’t place a unit from an org chart. Watch the work — what comes in, what goes out, who waits for whom — then draw it, not the titles and layers.
The map guides the walk
Once drawn, it shows where to look next: heavy dependency lines, hand-offs between incomplete units, the gap to the topology you need.
A shared artifact
The map can be reviewed, challenged and improved together, so leaders and workers co-own the discoveries that matter most.
FROM THE BOOK · 10X ORG, “GO SEE WITH A MAP”
Such a map doesn’t replace visiting the Gemba: mapping and Go See reinforce each other. … Once mapped, the value-creation terrain appears as a living structure—not a static org chart frozen in time—highlighting exactly where the improvement is most needed.
 MAPPING A REAL ORG CHANGE · CASE BY ALEXEY KRIVITSKY
Mapping Examples
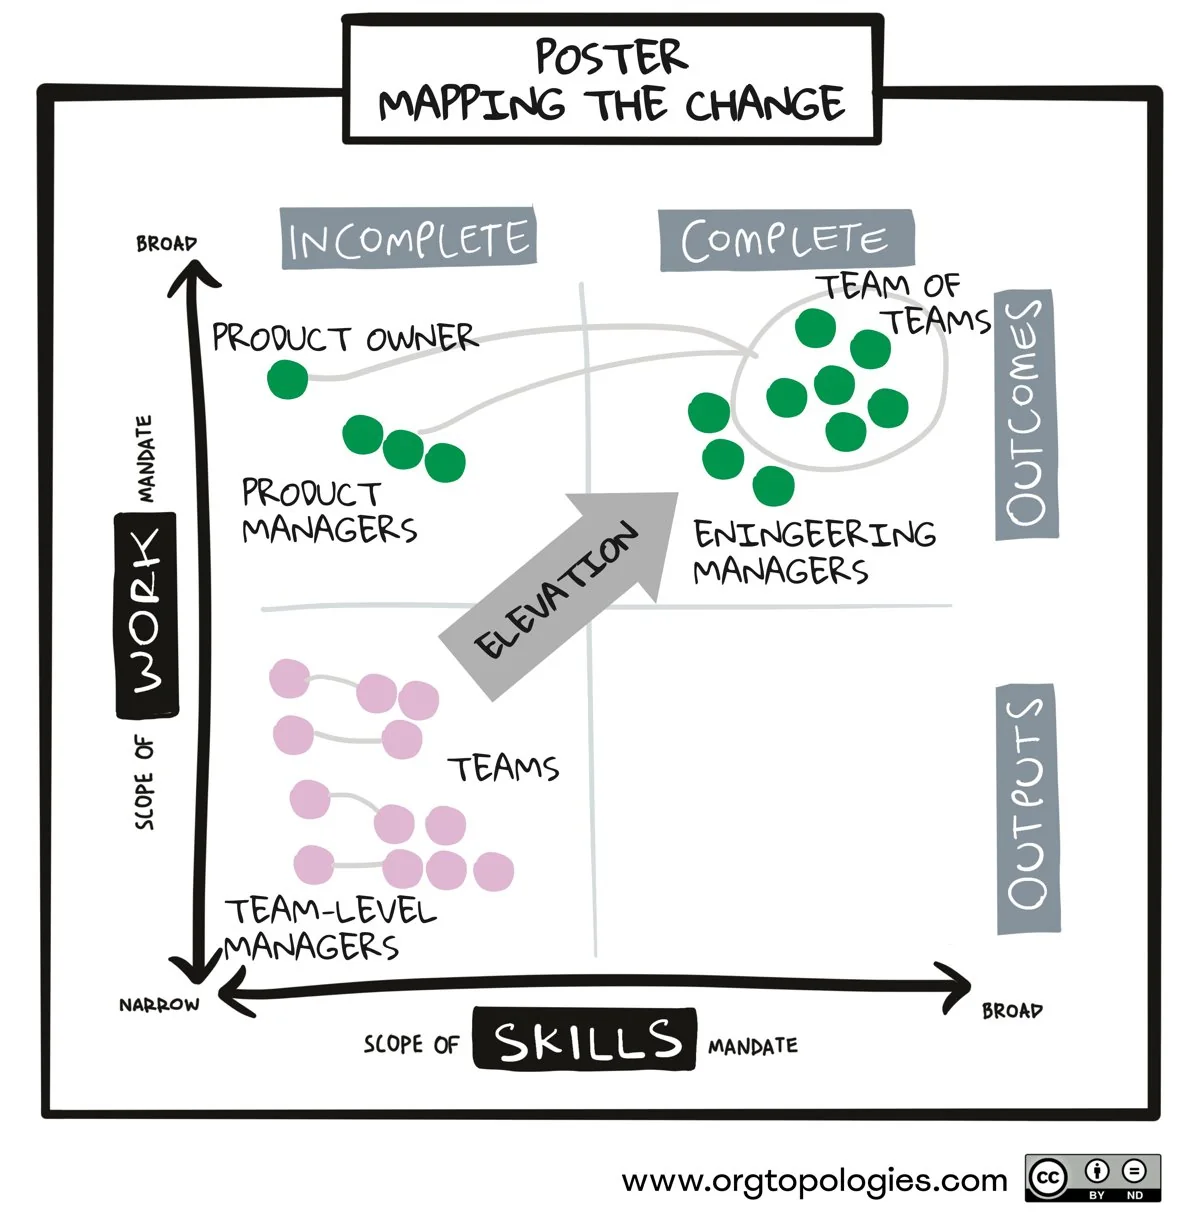
In 2021, Alexey Krivitsky helped Poster, a Ukraine-based SaaS company, rethink its organizational design. It reshaped its R&D from 12 narrow, component-oriented specialist teams into 6 versatile whole-product teams.
Before: Doing
Component teams with team-level managers, each with its own list of work, tied together by dependencies.
After: Driving
One team of teams on a shared product backlog, with a product owner, product managers and engineering managers around it.
Done means adopted
Teams took ownership of feature adoption: a feature is done once a selected client actively uses it.
Resilient by design
When COVID-19 and later the full-scale invasion hit, Poster did not need to redesign under pressure.
From the Community
Real organizations, mapped by the people who worked with them. Each map comes with the context you need to read it and a link to the full case study.
DIM.RIA: adapting in wartime
Resource topology: Head of Product, PMs and team leads in Directing; analytics, design and eight web, Android, iOS and QA teams in Doing; work flows down from the PMs. DIM.RIA is one of Ukraine’s leading real estate marketplaces. When the full-scale invasion hit the market in 2022, it redesigned its structure, entirely remotely, around LeSS principles. The map shows where it started: a Resource Topology (Directing + Doing), with product managers handing work down to many small teams. The case study tells how it moved toward an adaptive organization.
Flo Health: from domain silos to strategic ownership
A General manager joins the product manager, analyst, designer and UX researcher in Whole-1 (dotted ring); the same value creation, value capture, platform and support teams sit in Part-3, Caps-3 and Tasks-3. Flo Health, Europe’s first femtech unicorn, runs 20+ cross-functional product teams across mobile, AI, content, medical and commercial. Instead of dissolving its domain teams, Flo added a General Manager layer as an overlay, so each initiative has one owner while the domain teams keep their expertise.
Eurecat FPED: agility in a research unit
4x4 map with both states (AK 2026-10-05): initial state in black (four people in PART-1, four pools of people in CAPS-2); current state in blue (one person in WHOLE-1, four teams in PART-3, one pool of people in TASKS-1). FPED is a research unit at Eurecat, the Technology Centre of Catalonia, developing new manufacturing processes for plastic and composite materials. Heads of R&D lines moved from managing every detail towards Product Owner-like roles and delegated more to their teams. The map shows both states: the initial one in black, the current one in blue.
Paradigm: bringing business and IT together
Business owner hands to the central solution team in Part-2, which feeds a circled partial-solution team around the Part-3 / Caps-3 boundary; PO? and Ops? sticky notes mark open questions. An Agile Release Train in the planning domain of one of Europe’s largest technology companies, with trains organized around business capabilities. A next-generation planning solution, Paradigm, became the occasion to redesign. The map shows the optimal design: a team of teams at PART-3.
It started over dinner
Future state: Stacy in Part-1 hands work to a single team of teams in Part-3, which feeds the implementation unit in Tasks-2. A product manager in a government organization leads three product owners and four teams. On paper they are agile; in practice everyone works on their own backlog, and when one team is blocked the others watch. The map shows the future design: teams aligned to whole product domains that build, validate and run the product end to end.
de Volksbank: dev teams beside operations
4×4 map of de Volksbank in 2023: four dev teams at CAPS-2 (customer onboarding, new business lending ×2, maintenance) still paired with operations at TASKS-1, the bloxx team at CAPS-3, the vendor team at CAPS-1 and ten IT dev teams at TASKS-1. Business Banking at de Volksbank moved from developers working on tasks to feature teams paired with the operations teams they serve. By 2023 most of its four dev teams were CAPS-2, incomplete teams working on customer journeys, and one reached CAPS-3, working end-to-end. The map shows that reality, with the vendor and IT still around the teams.






FRAMEWORK MAPPINGS
Mapping Your Framework?
START MAPPING
Free tools & more mapping ideas
Miro template
Essentials and empty maps to start mapping with your team, online.
Framework mapping
“We are doing SAFe” says little about your design. See SAFe, LeSS, Team Topologies and more on the map.
STUDY COMMON TOPOLOGIES
Three topologies, three goals
Each common topology combines different intelligences — specialization, flow, coordination, adaptive — and “shines” in a different environment.
Resource
Doing + Directing (specialization + coordination intelligences)
- OPTIMIZES FOR
- Utilization & predictability
- BEST FOR
- Stable, process-driven environments
- TRADE-OFF
- Rigid when strategy shifts
Delivery
Delivering + Directing (flow + coordination intelligences)
- OPTIMIZES FOR
- Speed & flow within boundaries
- BEST FOR
- Known work that fits the team structure
- TRADE-OFF
- Cross-cutting work needs coordination
Adaptive
Driving (adaptive intelligence)
- OPTIMIZES FOR
- Adaptability & learning
- BEST FOR
- Volatile, innovation-driven contexts
- TRADE-OFF
- Challenges existing control structures
ACADEMY
Learn the Org Topologies approach
All upcoming events
 10–24 Nov 2026OnlineDesigning Adaptive Organizations for the Agentic Agefrom €450 excl. VATLearn moreThese practical live sessions are for executives, managers, consultants and change agents who want to redesign their organization for performance — and then let AI accelerate it.
 7–8 Dec 2026HamburgBootcamp – Org Redesign for Agentic Agefrom €1,495 excl. VATLearn moreA two-day, in-person bootcamp for consultants and leaders who redesign organizations. Bring a real case, map it with Org Topologies, and leave with a practical redesign direction and first steps to test it, so AI's speed turns into business results. Includes the path to C-OTC accreditation.
 17–18 Dec 2026PragueBootcamp – Org Redesign for Agentic Agefrom €1,090 excl. VATLearn moreA two-day, in-person bootcamp for consultants and leaders who redesign organizations. Bring a real case, map it with Org Topologies, and leave with a practical redesign direction and first steps to test it, so AI's speed turns into business results. Includes the path to C-OTC accreditation.
Community
TALK TO THE AUTHORS LIVE
Learn with community
Practitioners share maps, and the authors join the conversation live in Slack.
Join Slack